
Power:Cadence-test
After the critical power test, which is a test repeated 2-4 times per year and requires a couple of days to complete, We went through the Recovery and Performance status test. This is a test that is best repeated every 2-4 weeks and only requires 16 minutes and 30 seconds of your day, showing your current training status. We then move on to a third, even shorter and mentally easier test format.
The critical power test essentially shows the ceiling of your central capacity—that is, what your heart and lungs can deliver in relation to your local capacity, meaning the capacity of the working muscles. The test results reveal the shift between two critical energy systems:
The energy system where the inflow of energy to the working muscles is in balance with the power output you produce (commonly called the aerobic energy system – access to oxygen supply).
The energy system where the inflow of energy cannot keep up with the outflow quickly enough (called anaerobic – no access to oxygen supply). The recovery and performance status test shows the condition of both central and local capacity, and whether one (or both!) is fatigued or fresh. By continuously monitoring the development of the training condition test over a long period, you can track your progress and adjust your training if it trends in the wrong direction for an extended time before it’s too late.
The third test, which we call the Power:Cadence test, can provide an indication of how well the transport and communication between the central and local parts are functioning, i.e., the nervous system. The nervous system can also become fatigued. The tricky part about this test, and the nervous system in general, is that you do not "feel" tired in the same way as you do after "normal" training stimulus.
The nervous system requires energy and sends signals between the brain and the working muscles, and the “transport system” can also become weakened, even if you don’t notice it the same way. It also takes time to recharge the battery again to return to the same baseline.
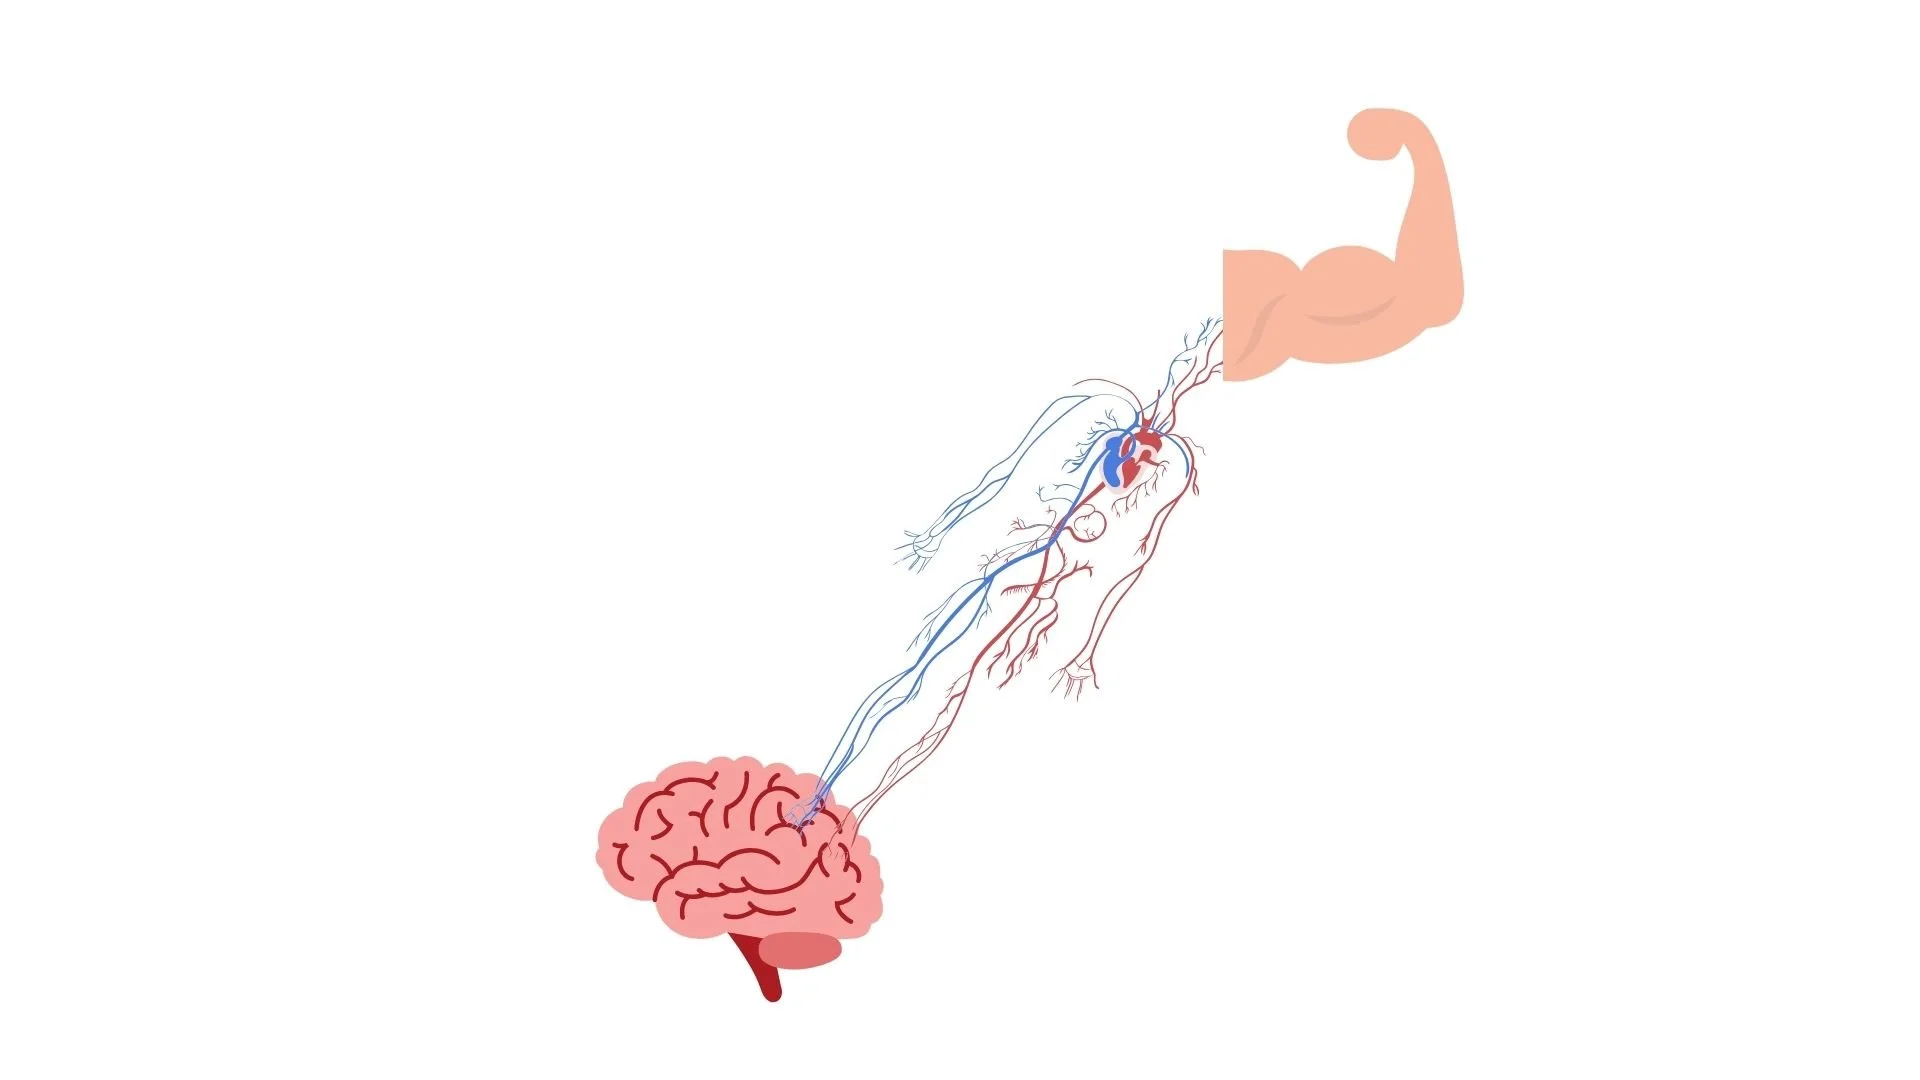
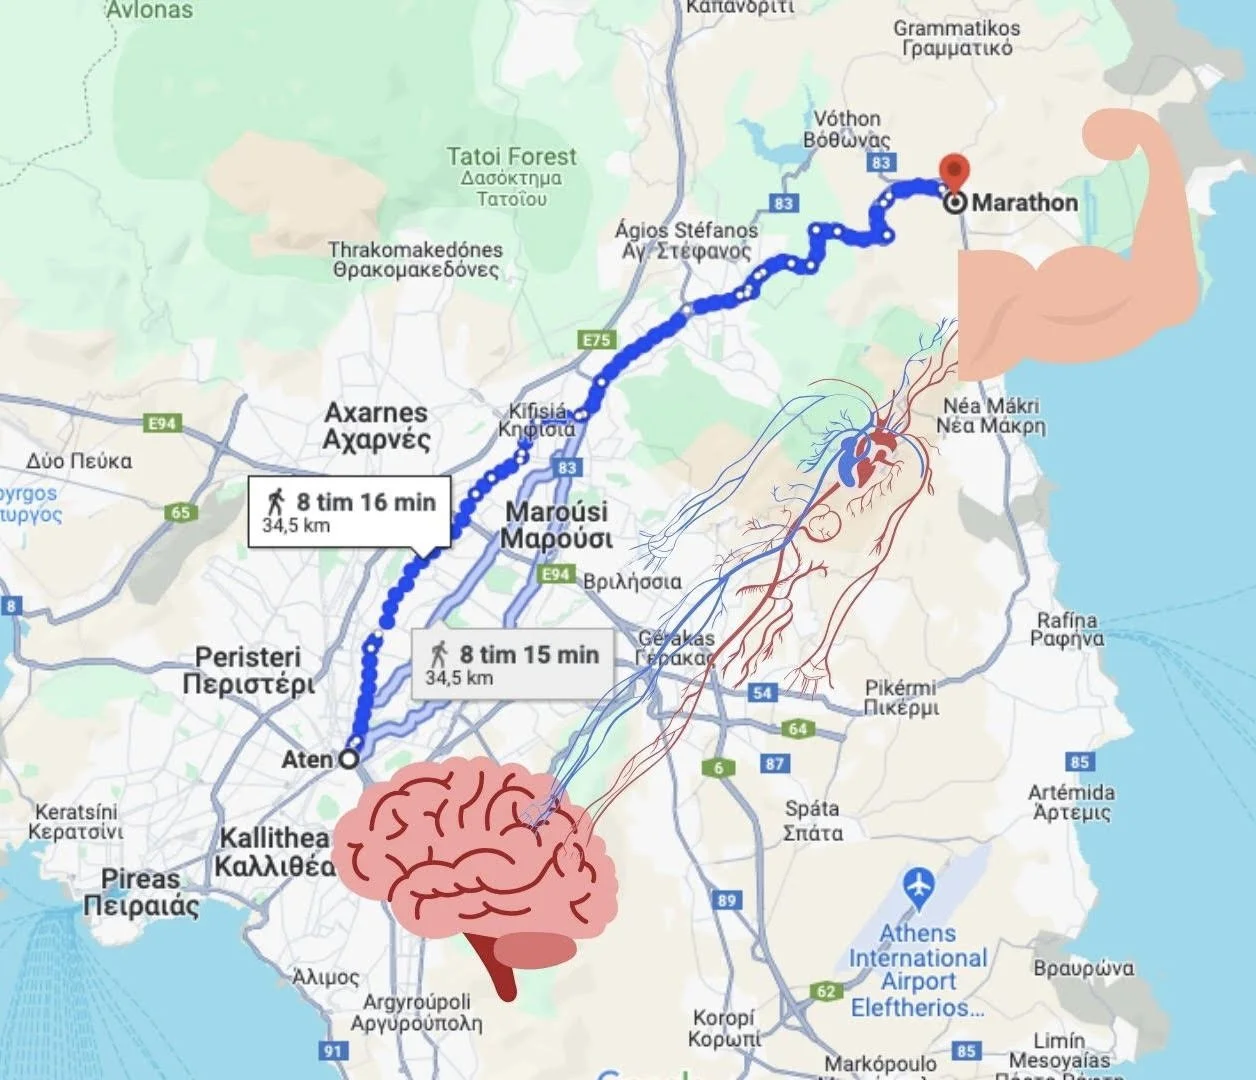
The analogy can be made with Pheidippides, the Greek messenger during the Battle of Marathon in Greece 2,500 years ago. The soldier Pheidippides ran 42.195 kilometers with the news that the Persians had won the war, from the battlefield in Marathon to the leaders of Athens. When Pheidippides delivered the message, he died of exhaustion.
How can this be an analogy? Imagine that the leaders in Athens decide what is to be done. Athens is the brain. The soldiers in Marathon are those performing the critical work. The soldiers are the muscles. Pheidippides delivered information between the brain and the muscles. Pheidippides is the nervous system. The nervous system became very tired and died. But the nervous system's (Pheidippides) fatigue was not noticed by the muscles (Marathon) or the brain (Athens). It was only Pheidippides himself who noticed that he was so exhausted that he died.
Since then, the development of running the 42.195 kilometers has advanced and been trained properly to a great extent, so the world record for the distance is 02:00:35.
In the same way that the development of marathon running has evolved from the death of the messenger Pheidippides to Kelvin Kiplimo’s world record in 2023 at 02:00:35, you can develop speed and power in your nerve signals by measuring and training the nervous system.
How is this measured?
By measuring airtime using tools like a force plate or a jump mat during plyometric jumps, vertical jumps, Counter Movement Jump, Squat Jump, Drop Jump, etc., one can calculate jump height. However, force plates or jump mats are not commonly accessible, and we would prefer to perform more sport-specific tests than just two-foot jumps.
Introducing the power:cadence test
A power:cadence test is a maximal sprint from standstill (0 rpm) or slow rolling against a constant resistance (same gear and road incline) adjusted so that the cyclist reaches between 120 – 150 rpm after 3 – 7 seconds. Muscles have an optimal contraction speed depending on their fiber composition (see the "cycling physiology" section in Fredriks book Cykelträning). This means that the ability to produce power increases during acceleration (increasing cadence) up to an optimal point, then decreases again.
By continuously measuring cadence and power output (2 – 10 times per second) during this sprint, you get a graph like the one below. From this, you can read the cyclist’s maximal instantaneous power output (WPEAK) and at which optimal cadence it occurs (CadenceOPT).
Repeat 3-4 sprints with plenty of rest (>5 minutes) between them so that at least 1-2 sprints are good enough. Feel free to test on two or three different gears to find which is best.

The blue dots represent each pedal stroke. As the RPM increases, the pedal force (N) decreases. In the example above, we see that the cyclist reaches their WPEAK on the second or third pedal stroke.
By performing the Power:Cadence test frequently and continuously, you will observe daily variations in both WPEAK and CadenceOPT. The day-to-day differences can largely be attributed to fatigue/exhaustion in the nervous system, something that you cannot measure or even notice during regular endurance rides or critical power intervals.
Much like the soldiers who fought in Marathon 2,500 years ago, they were able to fight and win despite the messenger being slow with information; in the same way, the muscles in your legs can perform relatively hard work with nerve signals that are microseconds slower and more fatigued than when fully rested. The messenger also needs rest. Remember and respect that.
If you are more interested in muscle fiber typology…
Eline Lievens and colleagues has an excellent book about it that you can read here: https://drive.google.com/drive/home